In this article we introduce an easy way to use the Aplicom Data Service (ADS) and the open source data visualization solution Grafana to conveniently display time-series data of IoT devices. To make it easy, we have wrapped all the needed tools and configurations into Docker containers. This setup can be used as a quick demo and as a verification environment for ADS-based Telematics/IoT systems. Naturally, these ideas and components can also be used as a basis for actual production systems.
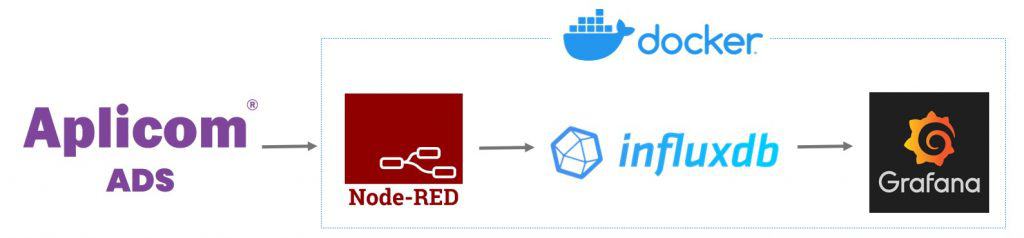
The test environment package consists of following parts:
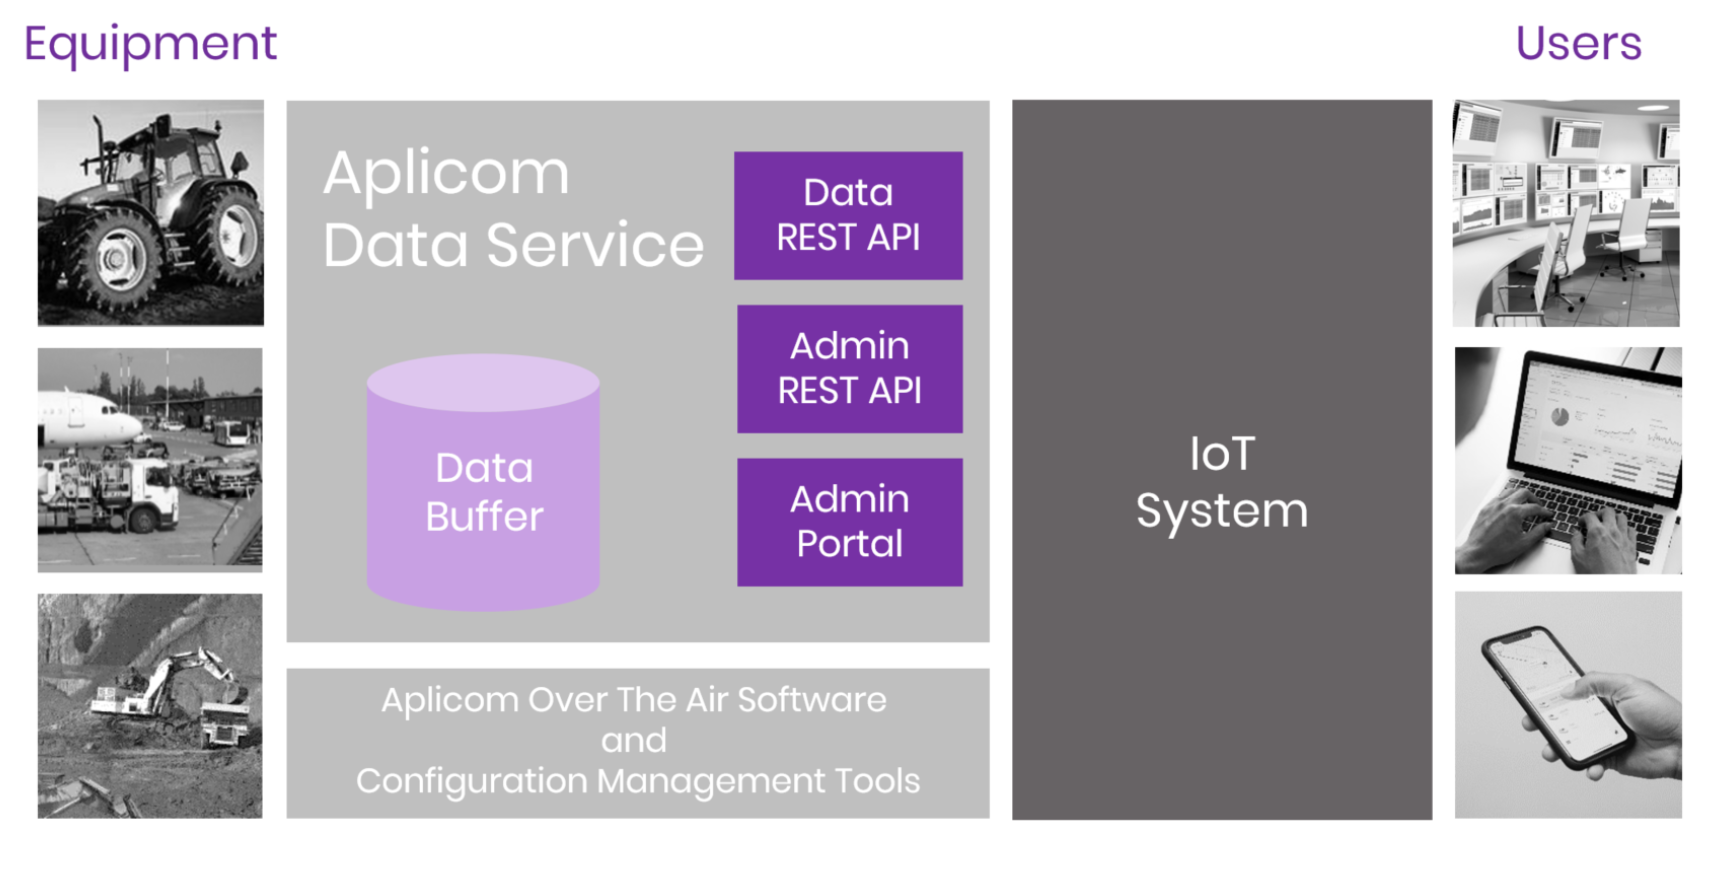
- Aplicom Data Service (ADS), a cloud service that collects data from Aplicom A-Series telematics devices. ADS takes care of delivering this data over a secured connection to a server, and performs data parsing so that the data is accessible over an API in JSON format. More information…
- Node-RED, a tool for wiring together hardware devices, APIs, and online services. Node-RED provides a browser-based editor that makes it easy to wire together flows using the wide range of nodes. Node-RED is used here to periodically save the data from ADS to a database. More information…
- InfluxDB, a time series database designed to handle high-volume write and query loads. InfluxDB is widely used for monitoring data in storage systems and real-time data in the IoT industry. More information…
- Grafana, a cross-platform, open source measurement analysis and visualization tool, which can be used to query and visualize the collected data. Grafana has many in-built visualization types and additional visualizations are provided as plugins. Grafana also supports multiple different data sources which can be combined into common dashboards. You can also use Grafana as an alerting system.
- Docker containers are used here to enable easy installation of the environment. More information…
How to get started
Installing the system is easy, and is not tied to any specific operating system. You can install the system on your local computer or on a cloud environment. In this article we focus on installing the system locally on Windows 10.
Please bear in mind that if you are installing the demo system on a public network please make sure that the services are appropriately secured. Details: Securing Node-RED, InfluxDB Administration and Grafana Security
Step 1: ADS activation
Please Contact us to get an ADS account. You also need some Aplicom A-Series devices, configured for ADS. If you don’t have any devices, please contact Aplicom Sales. Existing A-Series devices can be configured to send data to ADS with Aplicom Telematics SW Configurator. Please contact Aplicom Support for further assistance, if needed. Operating up to nine units in ADS is always free of charge. You can test and prototype on a small-scale, free of charge. Invoicing starts when the tenth device is activated in ADS. Until then, no fees are charged.
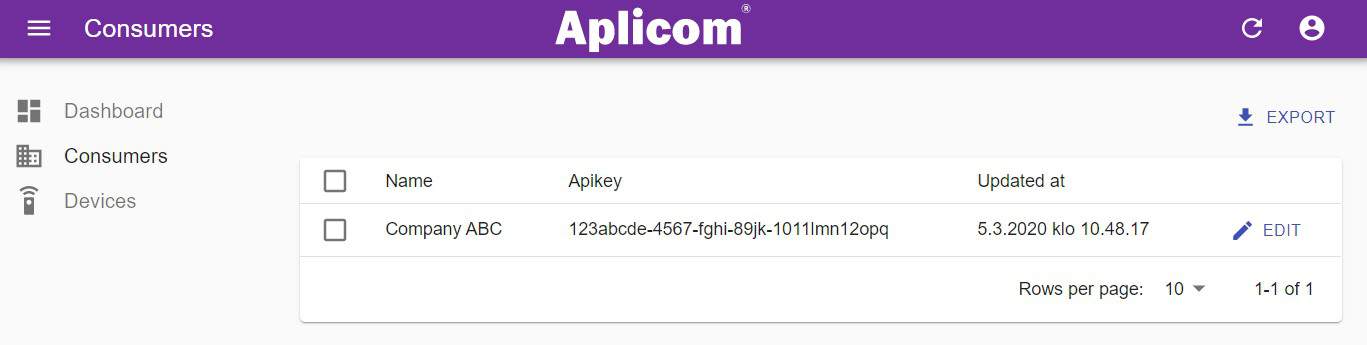
After you have your ADS account set up, log in to the ADS Admin UI to get your Apikey.
Step 2: Docker installation
Please refer to Docker documentation for installation instructions for your platform:
Step 3: Demo system installation
- Download the Docker configuration files here:
- Extract the zip package
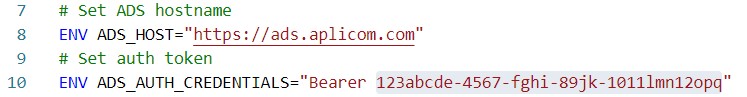
- Navigate to the folder containing the extracted files and go to the nodered directory and open a file called: Dockerfile in your text editor.
- Edit the ADS_AUTH_CREDENTIALS line to match your ADS Apikey:
- Open Windows PowerShell (or Linux terminal)
- Navigate to the directory where zip package was extracted and run command:
docker-compose -f "docker-compose.yml" up -d --build
Step 4: View and modify to your needs
After running the command, you should see similar view in Docker Dashboard. You can also list running containers by typing docker ps in the shell.
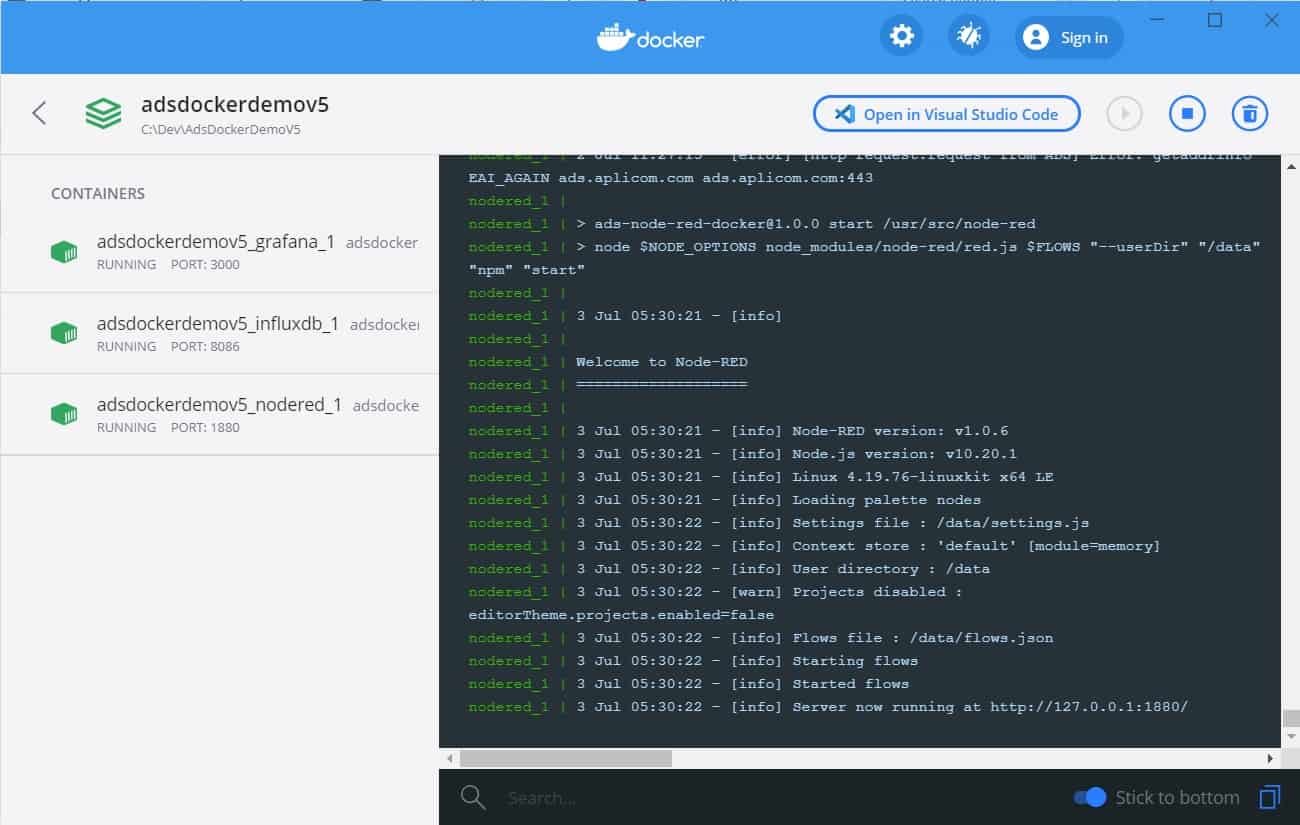
- Node-RED takes care of the data synchronization between the database (InfluxDB) and Aplicom ADS.
- You can point your browser to http://127.0.0.1:1880/ where you can find the Node-RED management UI, shown below.
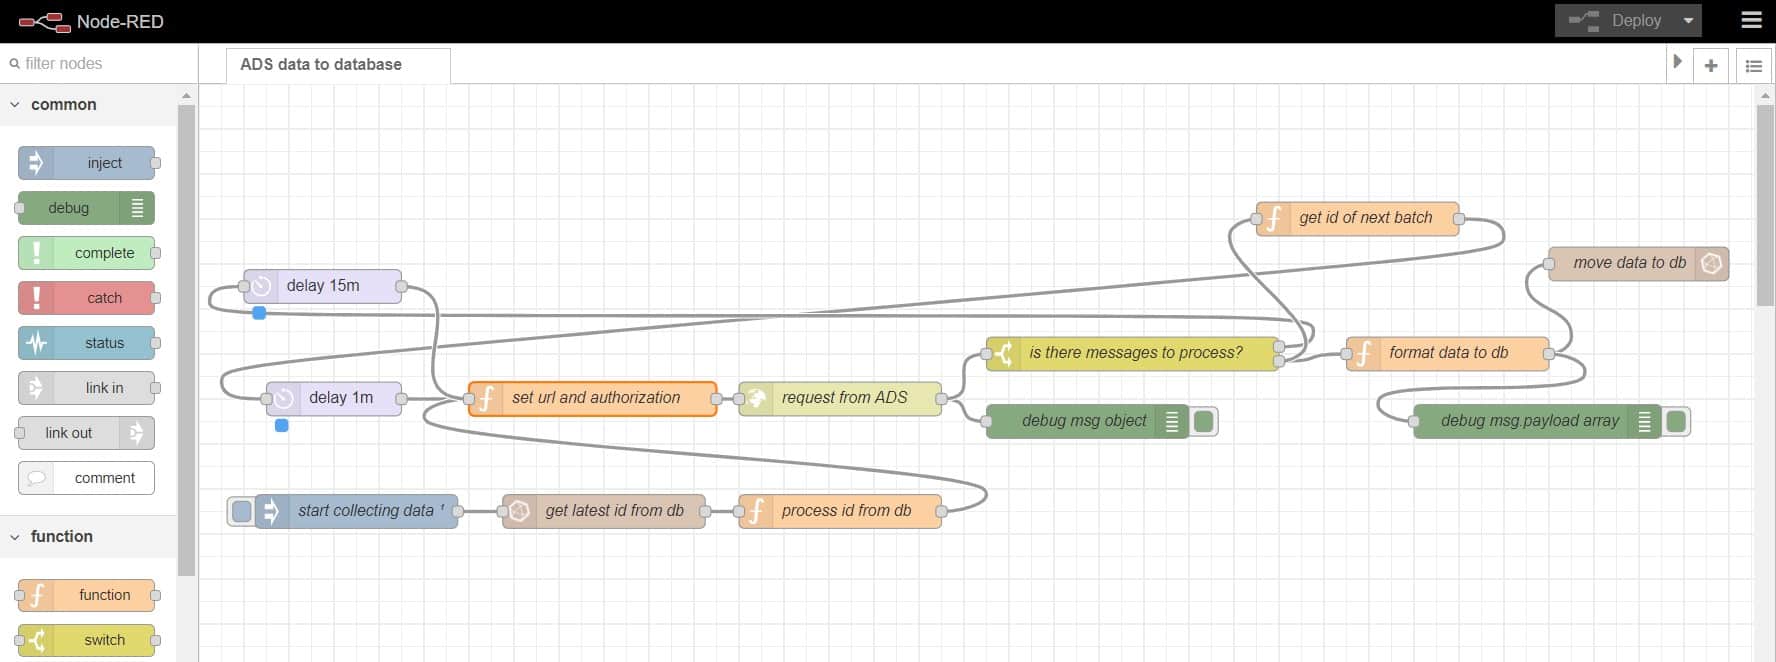
- For more information about Node-RED, please head to https://nodered.org/ to find documentation and examples.
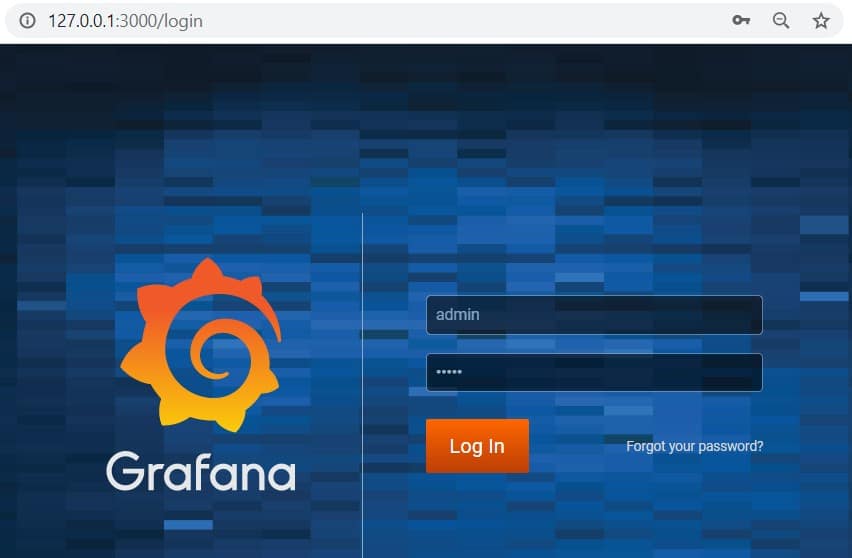
- You can now head to address http://127.0.0.1:3000/login (default credentials admin/admin) to see the data visualized in Grafana:
After logging in you should see the following Welcome Screen:
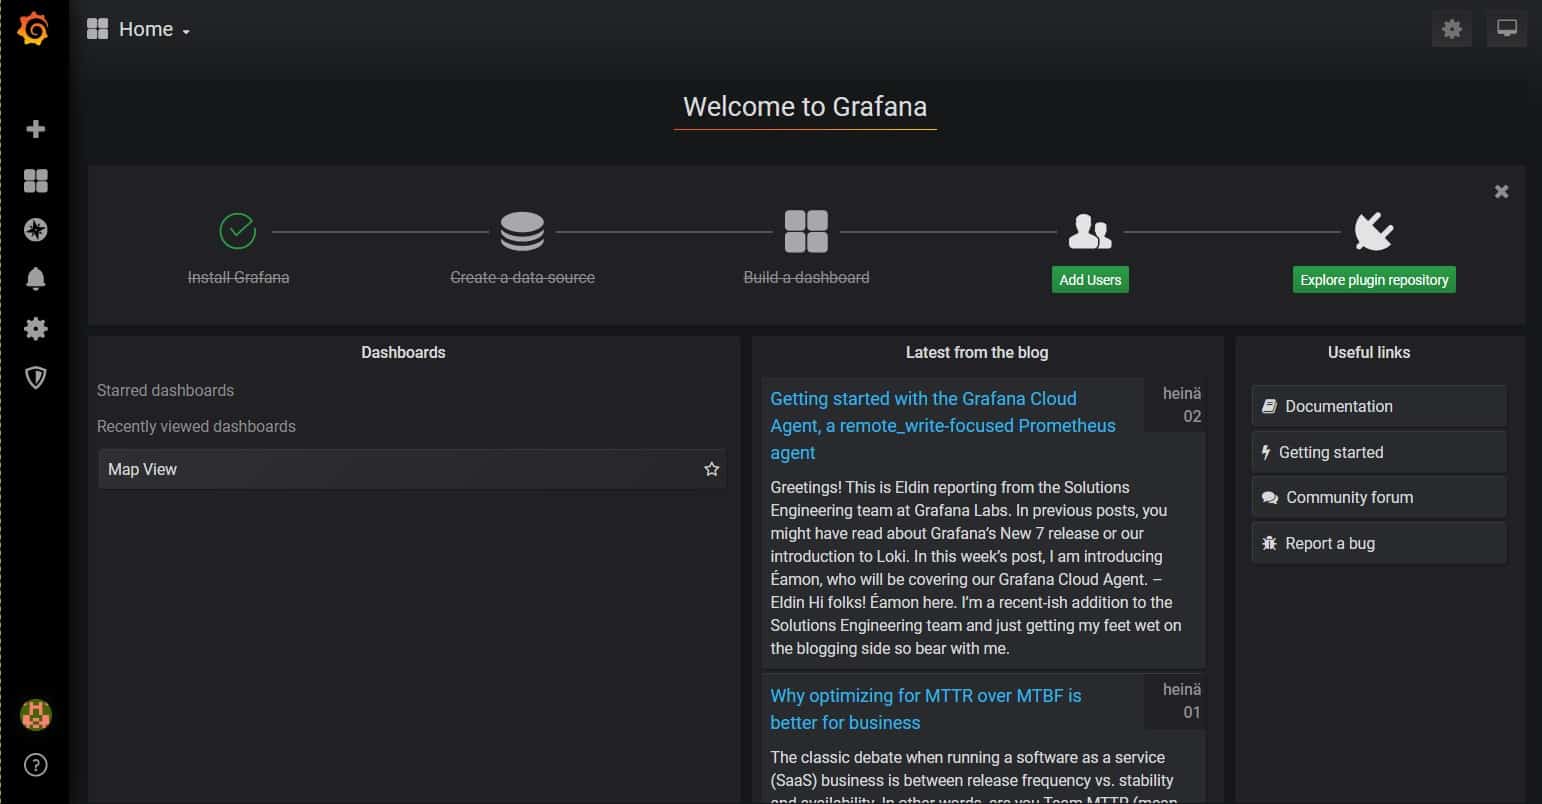
- Select the “Map View Dashboard” from the Welcome Screen. If you already have some data recorded from the devices you should see a view like this:
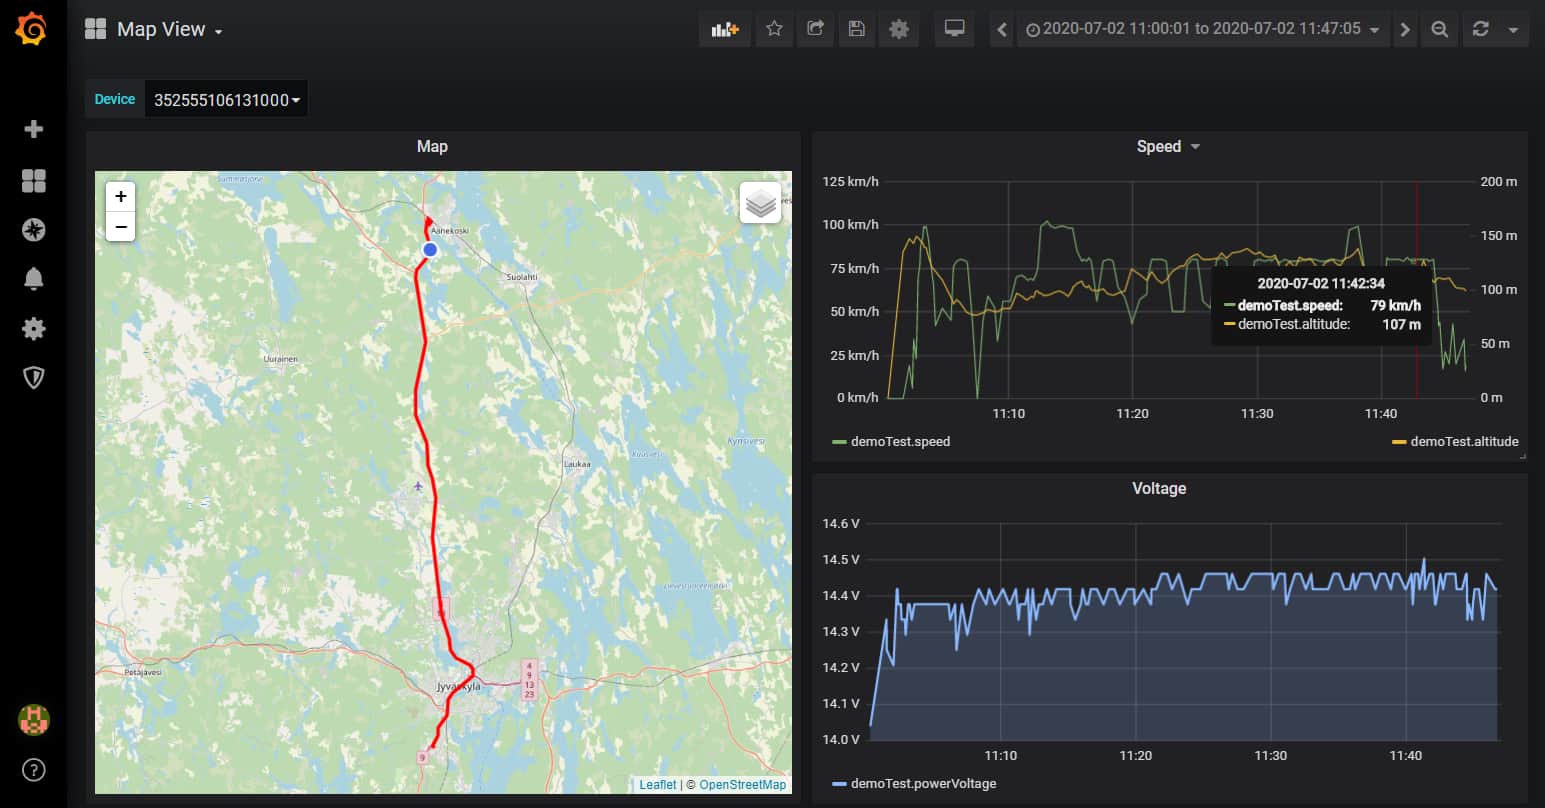
- You can easily customize the dashboard by adding different visualizations e.g. tables, line charts, labels. You can also customize the look and feel by using a different theme, and Grafana Enterprise version allows you to use Grafana as a white label product.
Summary
- Aplicom Data Service makes it really easy to integrate your Aplicom telematics devices into your telematics system.
- There are many existing technologies that make it easy to build Proof-of-Concept implementations and also speed up product development. Here we have used some of these technologies to enable quick start for using ADS telematics data.
Follow us on social media